 The State of the State Survey: Nevada (the Survey) is a product of the faculty and students associated with the Public Affairs Ph.D. program of the School of Environmental and Public Affairs within the Greenspun College of Urban Affairs at the University of Nevada, Las Vegas [1]. The Survey fosters the Program’s mission to:
“… serve as the nexus between the academic community and the world of service and practice in the private, non-profit, and public sectors.”
Thus, the primary purpose of the Survey is to provide the general public and policymakers information on what people in Nevada are thinking concerning important issues facing Nevada. Another function for the survey is to provide data for academic research including research on survey methodology. Equally important, the survey was conducted to provide doctoral students first-hand experience in designing and implementing a survey.
Consistent with the goal of conducting research on survey methods and training students, the State of the State Survey: Nevada has a number of unique features that are explained in sections below.
Who was surveyed?
A decision was made to conduct the survey using a population of registered voters in the state of Nevada. Voter registration lists provide a wealth of information that enables the implementation of a more manageable set of survey procedures and allows for an evaluation verification of the final data set. More detailed information about the sample and the sample procedures are provided later.
How was the survey conducted?
In order to provide students training on survey methodologies and to test the efficacy of different survey procedures a phone survey and two mail surveys were implemented. The phone survey used a much shorter questionnaire and was conducted by students from November until December. The phone survey was designed to take no more than ten minutes. Students attempted to reach every phone number in the sample at least two times. The typical phone survey would attempt to contact phone numbers more frequently: however, time constraints limited the phone survey to two attempts (given the phone survey is a teaching tool the two attempts was deemed to be sufficient). The phone survey does not serve as a source for the results reported on the website.
Both mail surveys used the exact same questionnaire, but one survey went into the field with a much more impersonal style than the second. For example, the more impersonal survey was sent using non-profit mail and no signature from the principal investigator, while the other mail questionnaire used first class postage and was signed by the principal investigator. In survey research there has been a debate over the efficacy of the exact approach to obtain a sufficiently large enough set of returned questionnaires and a high enough response rate to reduce survey error. To both teach and test the effects of different mail survey approaches, one survey used a sample of 3,000 registered voters. That sample was sent the survey only one-time (it did have a follow-up postcard one week after the survey was mailed reminding and thanking people – – hereafter referred to as the one-time survey). The second mail survey used a smaller sample, 1,000 registered voters, and was conducted using a rather typical set of procedures that included an initial mailing with the questionnaire, a postcard, a third mailing to those who had not responded which included another questionnaire.[2] Finally, three weeks after the third mailing, those individuals who had still not responded were identified and subsequently divided into three sub-groups. One group was sent another questionnaire through standard mail while a second set of non-responders was sent another questionnaire, but was also contacted by phone requesting that they return the questionnaire. The remaining third was again sent the questionnaire, but this time the mail was sent with certified postage. This set of procedures will be referred to as the four-time approach. It should be noted that for both the one-time and the four-time approach, respondents were given the option of logging into a website that had the questionnaire, enter a special code, and complete the questionnaire.
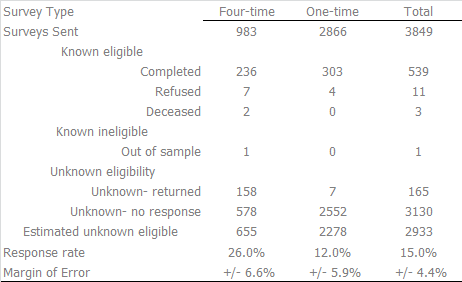
The two different procedures, the one-time approach and the four-time procedure, resulted, as expected, with different response rates. The response rate for the former was 12% while the response rate for the latter was 26%.[3] While the one-time had a lower response rate, the total number of respondents was 303 compare to the four-time number of 236.
Topics in the questionnaire
The major purpose of the survey was to understand what registered voters think about important issues confronting Nevada. To determine the topics to be covered in the survey, students involved in the development of the questionnaire studied statewide surveys conducted at other universities as well as developing their own topics, and questions. The students, as a group, discussed the potential topics and, as a class, determined the relevant topics. As a result, 102 questions were constructed for an eight-page questionnaire. The following broad topical areas have at least one question:
The exact wording of the questions and format of the questionnaire is presented here. It is expected that some questions will be repeatedly used in future State of the State Survey: Nevada surveys while other topics will be added or deleted as deemed appropriate. It should be noted that for the readers’ ease of interpretation some of the responses are recoded while other response categories are combined.
There were twelve demographic questions, but three important elements were not included on the questionnaire because they were obtained from the voters list: the age of the respondent, the party identification and place of residents. We have eliminated any record of place of residence from the data set to prevent any identification of the respondent. However, we did use residence to place individuals into one of three categories: Clark County, Washoe County, and the Rest of the State.
Sample Design
As noted previously, all three surveys were drawn from a list of registered voters – – thus the population consisted of Nevadan citizens over the age of 18.[4] The voter registration lists were obtained from the Nevada Secretary of State’s website as well as from the Clark County Election Department. The total number of registered voters as of September 2014 was 1,444,797. Of the registered voters, 69.5 percent were located in Clark County while another 18 percent lived in Washoe County. The remaining 12.5% lived in the remaining counties of Nevada. For all three samples, stratified samples were constructed reflecting the percentage of voters from each of the three sections of the state. Fortunately, the voter registration list has phone numbers for a significant number of voters (they can voluntarily provide their phone number). Thus, the registration list was subdivided between those with a phone number and those without a phone number. Once the list was divided, a stratified random sample of 3,000 phone numbers was selected. The remaining registered voters with phone numbers were then returned into the pool of registered voters. Another stratified sample of 3,000 voters was drawn. Once that sample was constructed another sample of 1,000 registered voters was constructed. In the final analysis, all three samples reflected the proportion of registered voters and, at least with regard to place of residence, age, and party identification reflect the comprehensive list of registered voters. The final composition of the two mail samples are provided in Table 1.
Sampling Error
The sampling error can be estimated for each mail survey. In addition, because there are no significant differences in the nature of the respondents in the basic demographic characteristics for the two surveys, we report the results from combining the two surveys. In only seven of the more than 100 questions were there any differences in response patterns as a function of the mail survey type. For those seven questions, the differences are highlighted so as to not create a response bias. The margin of error presented in Table 1 reflects a very conservative estimate. We estimate the margin of error as is there was a question with two response categories, yes and no, and if the proportion of respondents responding one way is .5 the remaining respondents would also respond at .5.
Table 1
Notes
[1] No state appropriated funds were used for this project.
[2] Actually, the samples drawn were 3,000 and 1,000, but the actual number of potential respondents was 2,866 and 983. The reduced samples were the result of two factors: the 3,000 sample was sent using an outside organization that handles non-profit mail and they excluded 134 addresses as no longer valid. The 1,000 sample was reduced because the registered voters had requested confidentiality when they registered to vote and we honored their request.
[3] Response rates were computed using the American Association for Public Opinion Research’s standard definitions and Outcome Rate Calculator.
[4] Obviously, the samples do not reflect all of the people residing in Nevada as it does not reflect those individuals who chose not to register to vote and those who are not eligible to vote because they are not citizens.